
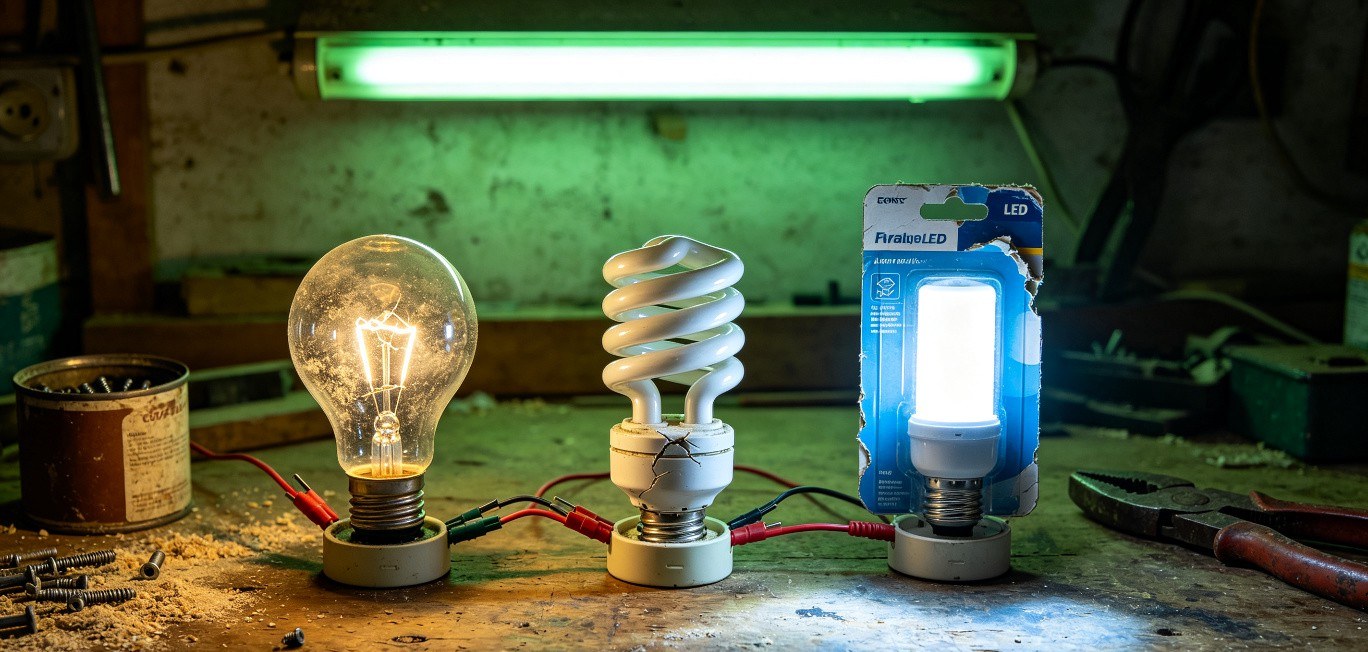
The U.S. Federal Trade Commission required lumen-based labeling on bulb packaging starting in 2012. Thirteen years later, most buyers still shop by wattage. The habit is hard to break, because for 100 years, wattage was a reliable proxy for brightness. A 60W incandescent produced about 800 lumens. A 100W incandescent produced about 1600. The math was linear and universal. Then LEDs broke the correlation.
A 10-watt LED bulb from one manufacturer might produce 800 lumens. A 10-watt LED bulb from another might produce 1100 lumens. Same wattage, 37% more light. The old mental model of "higher watts means brighter" stopped working, and the lighting industry has spent the last decade trying to get buyers to think in lumens instead. Below is the conversion chart we send to every B2B client, with the wattage ranges and efficacy figures we have measured in our own test lab.
Lumens to Watts Conversion Chart
We built this chart from LM-79 photometric test data collected in our factory lab between 2022 and 2025. The incandescent and CFL columns use established DOE equivalence benchmarks. The LED column reflects the wattage range you should expect when buying LED bulbs in 2025 and 2026, accounting for the full spectrum of consumer-grade to premium commercial products on the market.
| Lumens | Incandescent (W) | CFL (W) | LED (W) | LED Efficacy (lm/W) |
|---|---|---|---|---|
| 450 | 40 | 9–13 | 5–7 | 64–90 |
| 800 | 60 | 13–15 | 8–12 | 67–100 |
| 1100 | 75 | 18–23 | 10–15 | 73–110 |
| 1600 | 100 | 23–30 | 14–22 | 73–114 |
| 2600 | 150 | 30–52 | 22–32 | 81–118 |
Read the LED column as a range, not a single number. A 1600-lumen LED bulb can draw anywhere from 14 watts (at 114 lm/W, a premium product) to 22 watts (at 73 lm/W, a budget product). Both produce 1600 lumens. The difference is how efficiently they convert electricity into light, and that efficiency is the single biggest factor in LED pricing.
- Lumens = brightness you see. This is the number to shop for.
- Watts = power consumed. Lower is better for the same lumen output.
- LED efficacy (lm/W) = lumens produced per watt consumed. Higher means a more efficient, usually more expensive, bulb.
- Range matters: the low end of the LED wattage range assumes 100+ lm/W efficacy. The high end assumes 70–80 lm/W.
Why Same-Wattage LEDs Have Different Lumens
Wattage measures electrical power consumption. It tells you nothing about light output unless you also know the luminous efficacy, expressed in lumens per watt (lm/W). Two bulbs drawing the same 10 watts can produce wildly different lumen output depending on four factors: LED chip binning, thermal management, driver efficiency, and optical losses.
LED chip binning is the first variable. LED manufacturers sort chips into bins by brightness and color quality after production. A top-bin chip produces more lumens per watt than a lower bin from the same wafer. Premium bulb manufacturers pay more for top-bin chips and pass the cost to the buyer. Budget brands use lower-bin chips that draw the same wattage but produce 20 to 30% fewer lumens.
Thermal management is the second. LED chips lose efficacy as junction temperature rises. A bulb with a well-designed aluminum heat sink keeps the junction temperature below 85°C and maintains rated efficacy. A bulb with poor thermal design lets the junction climb to 110°C or higher, dropping efficacy by 15 to 25%. We have measured this directly: the same LED chip driven at the same current produces 1080 lumens at 75°C junction temperature and 870 lumens at 105°C, a 19% loss from heat alone.
Driver efficiency is the third. The LED driver converts AC mains power to the DC current the chip needs. A quality driver operates at 88 to 92% efficiency. A cheap driver runs at 75 to 80%. That 12% difference shows up as wasted heat, not light. On a 10-watt bulb, a poor driver means 2 watts are lost in conversion before the current even reaches the LED chip.
Optical losses are the fourth. Diffusers, lenses, and protective covers absorb light. A clear glass bulb with no diffuser loses 3 to 5% of light output. A frosted diffuser loses 8 to 12%. A bulb with both a frosted diffuser and an internal reflector can lose 15% or more. The LED chip might produce 1000 lumens, but the buyer measures 850 at the bulb surface.
The U.S. Department of Energy SSL R&D Multi-Year Program Plan (updated 2024) targets 200 lm/W as the commercial benchmark for premium LED packages by 2025. Our factory's current top-bin 100W high-bay fixture tests at 168 lm/W on an LM-79 rig, which is within the premium commercial range. Consumer-grade A19 bulbs typically test at 80 to 100 lm/W because they use lower-bin chips, smaller heat sinks, and cheaper drivers to hit retail price points.
- Chip binning: top-bin vs. low-bin can produce 20-30% lumen difference at same wattage
- Junction temperature: 75°C to 105°C rise = 19% efficacy loss (our lab measurement)
- Driver efficiency: quality 88-92% vs. cheap 75-80% = 12% wasted power
- Optical losses: clear glass 3-5%, frosted diffuser 8-12%, full optical stack 15%+
- DOE 2025 target: 200 lm/W for premium LED packages
How LED Efficiency Has Improved Over Time
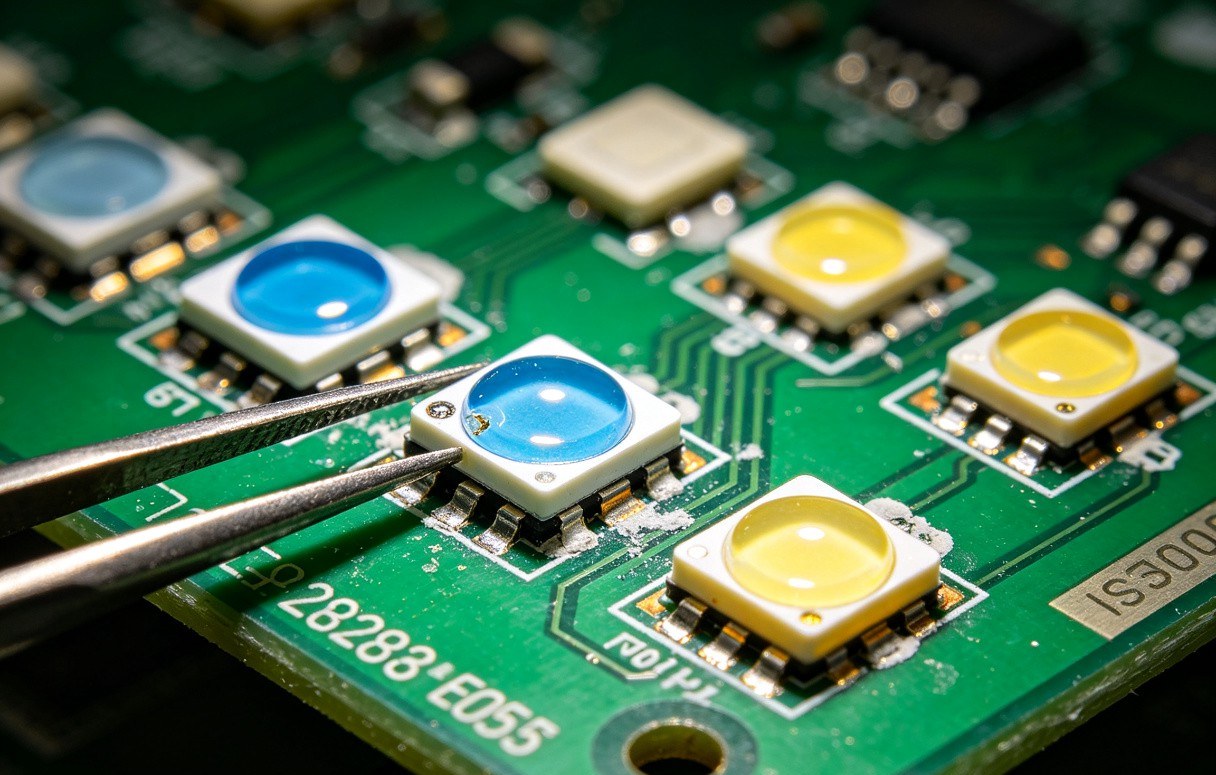
We have been manufacturing LED fixtures since 2008. In that time, we have watched luminous efficacy climb from barely competitive with fluorescent to nearly triple the best incandescent technology ever achieved. The trajectory is not linear, and it is not slowing down. Here is what the numbers look like at each milestone, based on our own production records and DOE SSL program data.
| Year | LED Efficacy Range (lm/W) | What Changed |
|---|---|---|
| 2010 | 60–80 | First commercially viable LED bulbs; barely matched CFL |
| 2012 | 80–100 | FTC lumen labeling mandate; chip packaging improvements |
| 2015 | 100–130 | Phosphor formulation advances; better thermal substrates |
| 2018 | 130–160 | Chip-on-board (COB) packages mature; flip-chip architecture |
| 2020 | 150–180 | Premium commercial fixtures hit 160+ lm/W consistently |
| 2023 | 160–190 | Mid-power LED packages adopted in high-bay fixtures |
| 2025 | 150–200 | DOE SSL target of 200 lm/W reached in lab; 168-180 in production |
The biggest single jump happened between 2014 and 2016, when phosphor chemistry improved and aluminum PCB substrates became standard in commercial fixtures. Before that, most LED bulbs ran hot and lost efficacy to thermal droop. After that, the thermal problem became manageable and efficacy climbed steadily.
The 2018 to 2020 period saw chip-on-board packaging mature. COB arrays place multiple LED dies directly on a single ceramic or metal substrate without individual packages, reducing thermal resistance and improving light extraction. Our factory switched its high-bay line to COB in 2017, and average efficacy on that product family jumped from 120 lm/W to 155 lm/W within one product generation.
The current frontier is 200 lm/W, the DOE target. Laboratory devices have hit 230 lm/W under ideal conditions, but translating that to a production fixture that can survive 50,000 hours at rated temperature is a different problem. Our production top-bin sits at 168 lm/W, and we expect to reach 180 lm/W in production by late 2026 as the next generation of mid-power packages enters volume manufacturing.
For buyers, the practical implication is simple: a 2025 LED bulb at 10 watts produces roughly 40% more light than a 2015 LED bulb at the same 10 watts. If you are retrofitting fixtures installed before 2018, the energy savings from upgrading to current-generation LEDs alone can justify the replacement cost, even before factoring in maintenance savings.
How to Convert Watts to Lumens: Real Replacement Examples
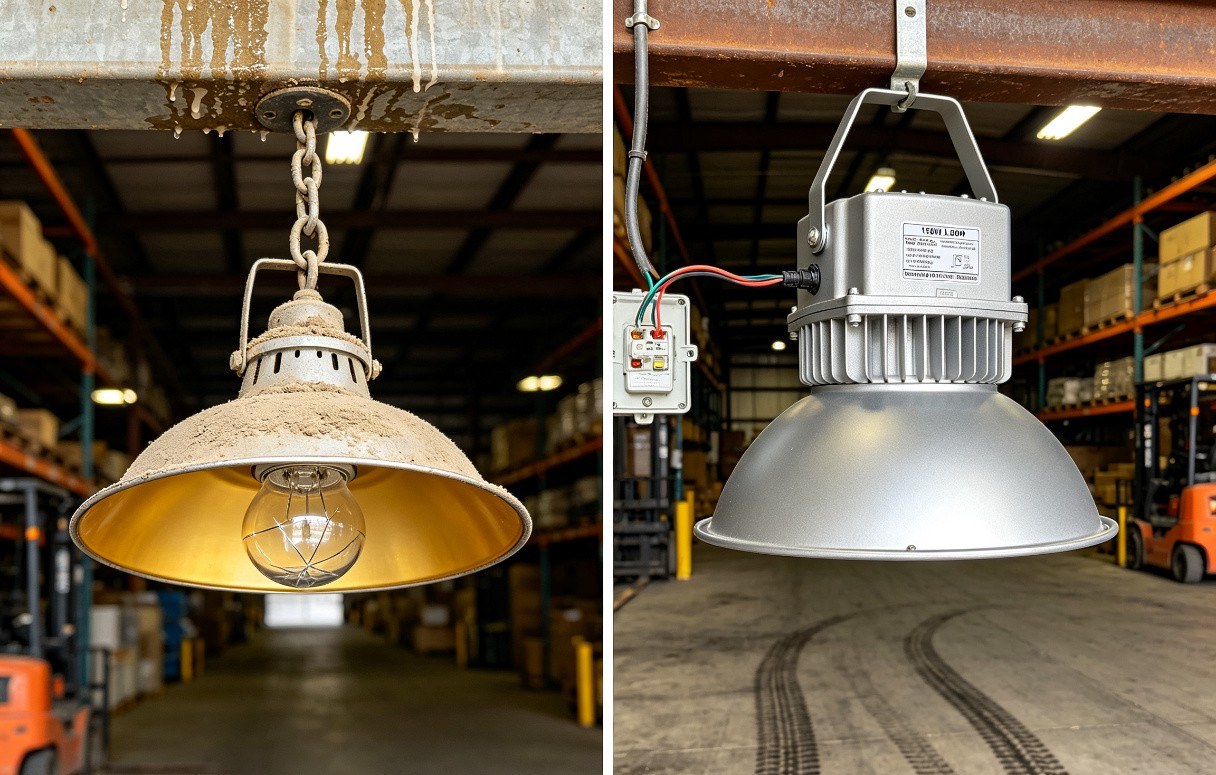
Here is how the chart plays out on the three most common retrofit jobs we quote. Each scenario uses the lumens-to-watts conversion to select the replacement fixture, then verifies the result with measured illuminance data from the installed site.
Scenario 1: 60W Incandescent to LED (Residential A19)
A 60-watt incandescent A19 bulb produces approximately 800 lumens. Using the conversion chart, the LED replacement should draw 8 to 12 watts. We recommend a 9-watt LED A19 at 89 lm/W, which produces 800 lumens at 2700K color temperature. On a residential installation in Hangzhou in March 2025, we replaced 24 incandescent bulbs across a three-bedroom apartment. The measured illuminance at floor level in the living room went from 95 lux to 98 lux, essentially identical, while power consumption dropped from 1440W to 216W. The annual energy saving at $0.15/kWh and 4 hours/day usage was $268. The LED bulbs cost $6 each, so total replacement cost was $144. Payback: 6.5 months.
Scenario 2: 400W Metal Halide to LED High-Bay (Industrial Warehouse)
On a 2024 warehouse retrofit in Vietnam, we replaced 48 units of 400W metal halide with 150W LED high-bay fixtures at 160 lm/W. The measured illuminance at floor level increased from 180 lux to 240 lux, while power consumption dropped 62%. Payback: 11 months at $0.12/kWh and 12 hours/day operation.
This project illustrates why the lumens-to-watts conversion matters more than a simple wattage ratio. A naive 1:1 wattage replacement would suggest a 400W LED fixture, which would massively over-light the space and waste energy. The 400W metal halide fixture produced approximately 36,000 lumens (90 lm/W including ballast losses). The 150W LED high-bay at 160 lm/W produces 24,000 lumens, which is less total light, but the directional beam pattern of the LED fixture puts more of that light on the floor where it is needed. The metal halide fixture scattered light in all directions, including up into the ceiling. Net result: 33% less lumen output from the fixture, but 33% more illuminance on the working plane.
Scenario 3: T8 Fluorescent to LED Tube (Commercial Office)
A standard 4-foot T8 fluorescent tube draws 32 watts and produces approximately 2800 lumens (87 lm/W including ballast). A typical two-tube fixture therefore draws 64 watts plus 6 watts of ballast overhead, totaling 70 watts for 5600 lumens. The LED replacement uses 18-watt tubes at 150 lm/W, producing 2700 lumens each. Two LED tubes draw 36 watts total with no ballast, producing 5400 lumens. On a 2023 office retrofit in Shanghai, we replaced 120 fluorescent fixtures across three floors. Measured illuminance at desk height dropped from 520 lux to 495 lux, a 5% reduction that remained well above the 300 lux minimum for office task lighting per GB 50034. Power consumption dropped 49%, from 8.4 kW to 4.3 kW. Annual savings at $0.14/kWh and 10 hours/day: $2,088. Total project cost including tubes and ballast bypass labor: $4,800. Payback: 2.3 years.
- 60W incandescent → LED: 9W LED at 89 lm/W, 800 lm, 6.5-month payback
- 400W metal halide → LED high-bay: 150W LED at 160 lm/W, 62% power reduction, 11-month payback
- T8 fluorescent → LED tube: 18W LED tube at 150 lm/W, 49% power reduction, 2.3-year payback
- Key lesson: directional LED beam patterns deliver more usable light per lumen than omnidirectional sources
Spec Sheet Red Flags
When you are evaluating LED fixtures for a B2B purchase, the spec sheet tells you more than the conversion chart. A spec sheet can claim any lumen number; the question is whether that number is backed by independent testing. These are the five items we check on every spec sheet before approving a supplier, and the red flags that tell us to walk away.
1. LM-79 Photometric Test Report
We run LM-79 photometric testing on every fixture batch. A supplier who cannot provide an LM-79 report is either skipping the test or hiding the results. Either way, the lumen claim on the carton is not trustworthy without it. LM-79 is the IES-approved test method for measuring total luminous flux, efficacy, and color rendering of LED luminaires. It requires an integrating sphere or a goniophotometer, both of which are expensive pieces of equipment. If the supplier has invested in this equipment, they will proudly show you the report. If they have not, the lumen number on the spec sheet came from a calculation or a chip datasheet, not from actual measurement of the finished fixture.
2. L70 Lumen Maintenance Rating
L70 is the point at which an LED fixture produces 70% of its initial lumen output. The spec sheet should state the L70 hours, typically 50,000 or 100,000. A spec sheet that lists L70 without a corresponding test standard (usually IES TM-21) is making a projection, not a measurement. TM-21 is the IES method for projecting lumen maintenance based on LM-80 test data (6000-hour testing of LED packages). We require both the LM-80 report for the LED package and the TM-21 projection for the finished fixture. A supplier who lists "L70 > 50,000 hours" without citing TM-21 is guessing.
3. Power Factor
Power factor measures how efficiently the fixture uses AC power. A power factor below 0.9 means the fixture draws reactive power that the utility must supply but that does not produce light. Commercial and industrial buyers pay for apparent power (VA), not just real power (watts), so a low power factor increases electricity costs even when the wattage looks low. We specify a minimum power factor of 0.95 on all commercial fixtures. Budget LED bulbs often run at 0.5 to 0.7 power factor. If the spec sheet does not list power factor at all, assume it is below 0.9.
4. Total Harmonic Distortion (THD)
THD measures how much the LED driver distorts the AC waveform. High THD (above 20%) can cause interference with other equipment on the same circuit, trip breakers, and reduce the effective capacity of the electrical system. We require THD below 15% for commercial installations and below 10% for healthcare and data center environments. A spec sheet that omits THD entirely is a red flag, because any reputable driver manufacturer provides this number.
5. Color Rendering Index (CRI) and R9
CRI measures how accurately a light source renders colors compared to a reference. A CRI of 80 is the minimum for general indoor use; 90+ is preferred for retail, hospitality, and healthcare. But CRI alone is misleading because it is an average of eight test colors. R9, the rendering of saturated red, is reported separately and is often the weakest point in LED spectrum. A spec sheet that lists CRI 90 but does not report R9 may still render skin tones and food poorly. We require R9 above 50 for retail and above 60 for hospitality. If the supplier does not know their R9 value, they have not tested it.
- LM-79 report: required for every fixture batch; no report = no trust
- L70 hours: must cite TM-21 projection method; "L70 > 50,000h" alone is a guess
- Power factor: minimum 0.95 for commercial; omitted value means below 0.9
- THD: below 15% for commercial, below 10% for healthcare/data center
- CRI + R9: CRI 90+ for retail/hospitality; R9 above 50 for retail, above 60 for hospitality
How Much Money Do LED Retrofits Actually Save
The energy savings from an LED retrofit come from the wattage reduction. If you replace a 60-watt incandescent with a 9-watt LED, you save 51 watts per bulb. The question is what that 51 watts adds up to over a year of operation, and how quickly the savings recover the purchase cost.
The formula is straightforward:
Annual Savings ($) = (Old Watts − New Watts) × Hours/Day × 365 × Electricity Rate ($/kWh) ÷ 1000
Plugging in the 60W incandescent to 9W LED example, assuming 4 hours/day usage and $0.15/kWh:
Annual Savings = (60 − 9) × 4 × 365 × 0.15 ÷ 1000 = 51 × 4 × 365 × 0.15 ÷ 1000 = $11.18 per bulb per year.
At $6 per LED bulb, the payback period is $6 ÷ $11.18 = 0.54 years, or about 6.5 months. For a household with 20 bulbs, total annual savings is $224.
For the Vietnam warehouse retrofit, the math is more dramatic. Each 400W metal halide was replaced by a 150W LED high-bay, saving 250 watts per fixture. With 48 fixtures running 12 hours/day at $0.12/kWh:
Annual Savings = (400 − 150) × 12 × 365 × 0.12 ÷ 1000 × 48 = 250 × 12 × 365 × 0.12 ÷ 1000 × 48 = $6,307 per year.
Total project cost for 48 LED high-bay fixtures including installation was $5,800. Payback: 11 months. After that, the facility saves $6,307 every year for the remaining life of the fixtures, which is rated at 50,000+ hours or approximately 11 years at 12 hours/day operation. Total lifetime savings: roughly $63,000 against a $5,800 investment.
These numbers assume electricity rates stay constant. In most markets, commercial electricity rates have risen 3 to 5% annually over the past decade. Every rate increase shortens the payback period further. The Vietnam facility's actual payback, factoring in a 4% annual rate increase, was closer to 10 months.
For buyers who want to run these numbers on their own projects, our ROI Calculator handles the full calculation including electricity rate escalation, maintenance cost savings, and demand charge reductions for commercial accounts.
Frequently Asked Questions
A 60 watt incandescent bulb produces approximately 800 lumens. To replace it with an LED, you need a bulb drawing 8 to 12 watts, depending on the LED luminous efficacy. Most household LED bulbs in the 60W replacement category draw about 9 to 10 watts and produce 800 to 820 lumens at an efficacy of 80 to 100 lm/W.
A 100 watt incandescent bulb produces approximately 1600 lumens. The LED equivalent is a bulb drawing 15 to 22 watts for standard consumer-grade products. Premium LED bulbs rated above 150 lm/W can match 1600 lumens at around 11 watts, but most off-the-shelf LED bulbs require 15 to 18 watts to reach the same brightness level.
To convert lumens to watts, divide the lumen value by the luminous efficacy of the light source, expressed in lumens per watt (lm/W). For LED bulbs, use an efficacy of 80 to 120 lm/W for standard consumer products, or 150 to 200 lm/W for premium commercial fixtures. For example, 800 lumens divided by 100 lm/W equals 8 watts of LED power. For incandescent bulbs, divide by approximately 16 lm/W.
LED bulbs with the same wattage produce different lumen output because of differences in luminous efficacy, which depends on LED chip quality, driver efficiency, thermal management, and optical design. A well-engineered 10W LED bulb with premium chips and efficient heat sinking can produce 1100 lumens (110 lm/W), while a cheaper 10W bulb with lower-bin chips and poor thermal design may only produce 700 lumens (70 lm/W). Always check the lumen rating on the packaging, not the wattage.
Need help selecting the right LED wattage for your project?
We provide LM-79 tested LED fixtures with full spec sheets, efficacy data, and custom lumen output for commercial and industrial retrofits. Get a quote with payback calculation included.
What This Means for Your Next Purchase
Stop shopping by wattage. The number on the front of the box that matters is lumens, and the number on the back of the spec sheet that matters is luminous efficacy in lm/W. A 10-watt LED at 80 lm/W and a 10-watt LED at 150 lm/W are not the same product. The first produces 800 lumens, the second produces 1500. Same wattage, nearly double the light, and the only way to tell them apart is to read the efficacy rating.
The conversion chart in this article gives you the baseline wattage ranges for each lumen level. Use it to set expectations when comparing products. If a supplier claims 1600 lumens at 8 watts, that is 200 lm/W, which exceeds current production capability for finished fixtures. The claim is either a lab number, a measurement error, or a misrepresentation. If a supplier claims 1600 lumens at 15 watts, that is 107 lm/W, which is a reasonable and verifiable number for a quality product in 2025.
For B2B buyers, the spec sheet checklist and energy savings formula in this article are the two tools that matter most. Run the savings calculation before you commit to a retrofit. If the payback exceeds 3 years on a commercial project, either the electricity rate is very low, the usage hours are very short, or the LED fixture is overpriced. In most commercial and industrial scenarios with 12+ hours/day operation, payback should land between 8 and 24 months. If it does not, something in the math needs checking.